The FortiAnalyzer allows you to aggregate logs from multiple FortiGate firewalls giving you a central console to view logs, alerts and run reports for all the FortiGates in your organisation.
Each FortiAnalyzer can only handle a certain number of logs per second, be it the hardware or VM models. If you have dozens, hundreds or even thousands of FortiGates it would not be feasible to have all these devices send their logs to one FortiAnalyzer. Good news is that FortiAnalyzers can be configured in a 'collector' mode and deployed regionally to take the burden from your Analyzer that is doing the reporting.
One advantage of this is that FortiAnalyzer VMs that have been configured as a collector have no GB per day limitation as their standard config does. This means you'll only need a FortiAnalyzer VM BASE license for each of the remote regions.
In this example I'll configure two FortiGates and FortiAnalyzers that have been configured in collector modes. This will simulate two regions for my organisation and the firewalls within each region. The collectors will then forward their logs to the global Analyzer from where I can run reports for the entire organisation.
The FortiGates are running 5.4.0 and the FortiAnalyzers 5.2.5.
Let's begin with a quick diagram of what we are looking to achieve:

Here we have a firewall based in Boston that will be sending it's logs to the US FortiAnalyzer (configured as a collector). The Sydney firewall will send it's logs to the ASIA FortiAnalyzer. Both the US and ASIA collectors will then forward their logs to the GLOBAL Analyzer.
We'll be performing the following steps:
1. Configure Analyzers as a collectors
2. Connect FortiGate to collectors
3. Setup log forwarding on collectors
4. Add FortiGates on the Analyzer
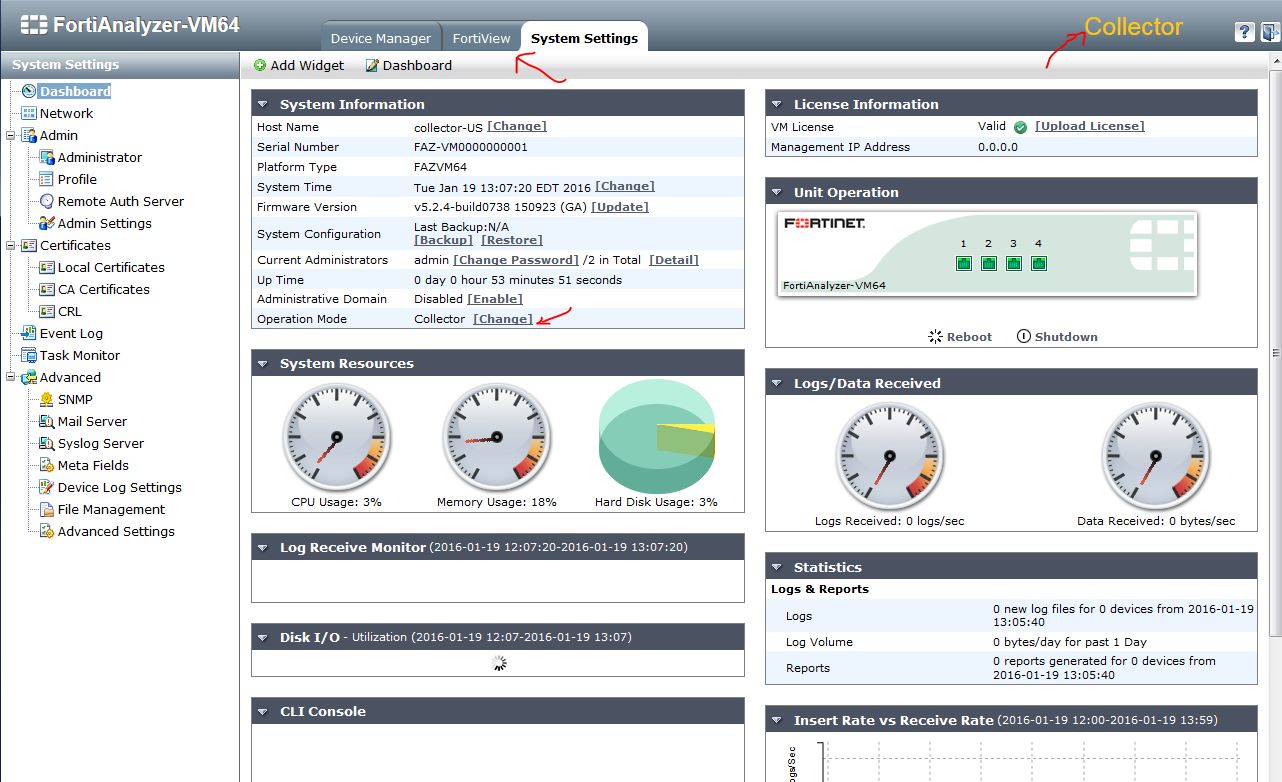
First we log into the collector-US Analyzer and goto System Settings > Dashboard. From here we select Change for the Operation Mode.

Select Collector and click Ok to save:

Once this is complete you will notice that a few things have changed on your Analyzer as it is no longer in 'Analyzer' mode. Confirm that you cannot see the Reports and Event Management tabs, that there is an orange 'Collector' in the top right hand corner and that the Operation Mode now reads Collector.

Make the same configuration change to collector-ASIA.
Now we configure the FortiGates to send logs to the collectors.
Login to fgt-boston and navigate to Log & Report > Log Settings. From here enable sending logs to FortiAnalyzer and type in the collector-US IP address. Select Realtime for the upload options and click Apply to save.

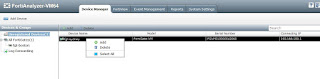
Refresh the Device Manager tab on the collector-US device and you will now see an unregistered device. Right click this device and select Add. Click OK to save the default and your FortiGate will now be added to the collector.

Once this has been added go back to fgt-boston and navigate to Log & Report > Log Settings. Click on the Test Connectivity button and confirm that your FortiGate has connected successfully to the collector.

Do the same now with fgt-sydney and collector-ASIA.
Login to collector-US and navigate to Device Manager > Log Forwarding. From here select Create New.

For the US collector we are going to configure real time forwarding. This means as soon as the collector gets logs from one of it's FortiGates then it will immediately sent it to the GLOBAL analyzer. This is good if you want to see real world data on the FortiView console of the Analyzer.
Enter the details as per below and click Ok to save:

Confirm the Log Forwarding has been configured correctly and that there's a green tick next to Real Time Logging:

Next we will configure the Log Forwarding on the collector-ASIA. For the Asian collector I want to change the configuration from real time to Log Aggregation. Log Aggregation will cause the collector to write all the logs to disk and compress/send them once per day to the Analyzer. This is good if you don't have much bandwidth and are only interested in logs for reporting purposes.
Log into collector-ASIA and add a Log Forwarder as per the previous steps.
The difference here is that we will now select Enable Log Aggregation, enter a password and select a time of day to upload the logs. Click Ok to save.

By default analyzer-GLOBAL will not accept these aggregated log uploads so we must enable them. To do this login to analyzer-GLOBAL and navigate to System Settings > Network. Enable Aggregator under the administrative access as per below. Click Ok to save.

This is not enough though. Since we configured a password on collector-ASIA in the previous step, we also need to configure this password on analyzer-GLOBAL. This is done via the CLI.
Login to the CLI of analyzer-GLOBAL and type the following commands in bold. Note that the password I have used in this example is password123
analyzer-GLOBAL # config system aggregation-service
(aggregation-service)# set password password123
(aggregation-service)# set accept-aggregation enable
(aggregation-service)# end
analyzer-GLOBAL #
Once this is done we can force collector-ASIA to send it's logs to test the connection is working correctly. In the collector-ASIA GUI navigate to Device Manager > Log Forwarding and right click on analyzer-GLOBAL. From here select Aggregate Now to force an aggregate log push so we don't have to wait for the scheduled upload.

We should now be able to see both FortiGates on analyzer-GLOBAL:

Each FortiAnalyzer can only handle a certain number of logs per second, be it the hardware or VM models. If you have dozens, hundreds or even thousands of FortiGates it would not be feasible to have all these devices send their logs to one FortiAnalyzer. Good news is that FortiAnalyzers can be configured in a 'collector' mode and deployed regionally to take the burden from your Analyzer that is doing the reporting.
One advantage of this is that FortiAnalyzer VMs that have been configured as a collector have no GB per day limitation as their standard config does. This means you'll only need a FortiAnalyzer VM BASE license for each of the remote regions.
In this example I'll configure two FortiGates and FortiAnalyzers that have been configured in collector modes. This will simulate two regions for my organisation and the firewalls within each region. The collectors will then forward their logs to the global Analyzer from where I can run reports for the entire organisation.
The FortiGates are running 5.4.0 and the FortiAnalyzers 5.2.5.
Let's begin with a quick diagram of what we are looking to achieve:

We'll be performing the following steps:
1. Configure Analyzers as a collectors
2. Connect FortiGate to collectors
3. Setup log forwarding on collectors
4. Add FortiGates on the Analyzer
1. Configure Analyzers as a collectors
First we log into the collector-US Analyzer and goto System Settings > Dashboard. From here we select Change for the Operation Mode.

Select Collector and click Ok to save:

Once this is complete you will notice that a few things have changed on your Analyzer as it is no longer in 'Analyzer' mode. Confirm that you cannot see the Reports and Event Management tabs, that there is an orange 'Collector' in the top right hand corner and that the Operation Mode now reads Collector.
2. Connect FortiGate to collectors
Now we configure the FortiGates to send logs to the collectors.
Login to fgt-boston and navigate to Log & Report > Log Settings. From here enable sending logs to FortiAnalyzer and type in the collector-US IP address. Select Realtime for the upload options and click Apply to save.

Refresh the Device Manager tab on the collector-US device and you will now see an unregistered device. Right click this device and select Add. Click OK to save the default and your FortiGate will now be added to the collector.

Once this has been added go back to fgt-boston and navigate to Log & Report > Log Settings. Click on the Test Connectivity button and confirm that your FortiGate has connected successfully to the collector.

Do the same now with fgt-sydney and collector-ASIA.
3. Setup log forwarding on collectors
Now that we have the FortiGates sending logs to the collectors we want to next have the collectors forward their logs to analyzer-GLOBAL. To do this we need to setup Log Forwarding.Login to collector-US and navigate to Device Manager > Log Forwarding. From here select Create New.

For the US collector we are going to configure real time forwarding. This means as soon as the collector gets logs from one of it's FortiGates then it will immediately sent it to the GLOBAL analyzer. This is good if you want to see real world data on the FortiView console of the Analyzer.
Enter the details as per below and click Ok to save:

Confirm the Log Forwarding has been configured correctly and that there's a green tick next to Real Time Logging:

Next we will configure the Log Forwarding on the collector-ASIA. For the Asian collector I want to change the configuration from real time to Log Aggregation. Log Aggregation will cause the collector to write all the logs to disk and compress/send them once per day to the Analyzer. This is good if you don't have much bandwidth and are only interested in logs for reporting purposes.
Log into collector-ASIA and add a Log Forwarder as per the previous steps.
The difference here is that we will now select Enable Log Aggregation, enter a password and select a time of day to upload the logs. Click Ok to save.

By default analyzer-GLOBAL will not accept these aggregated log uploads so we must enable them. To do this login to analyzer-GLOBAL and navigate to System Settings > Network. Enable Aggregator under the administrative access as per below. Click Ok to save.

This is not enough though. Since we configured a password on collector-ASIA in the previous step, we also need to configure this password on analyzer-GLOBAL. This is done via the CLI.
Login to the CLI of analyzer-GLOBAL and type the following commands in bold. Note that the password I have used in this example is password123
analyzer-GLOBAL # config system aggregation-service
(aggregation-service)# set password password123
(aggregation-service)# set accept-aggregation enable
(aggregation-service)# end
analyzer-GLOBAL #
Once this is done we can force collector-ASIA to send it's logs to test the connection is working correctly. In the collector-ASIA GUI navigate to Device Manager > Log Forwarding and right click on analyzer-GLOBAL. From here select Aggregate Now to force an aggregate log push so we don't have to wait for the scheduled upload.

4. Add FortiGates on the Analyzer
Our last step is to add the FortiGates to analyzer-GLOBAL. Login to analyzer-GLOBAL and navigate to Device Manager. You should now see both FortiGates under Unregistered Devices. Add these the same way we did in step 2.
We should now be able to see both FortiGates on analyzer-GLOBAL:

No comments:
Post a Comment