This quick how-to guide will go through creating a chart/report on a FortiAnalyzer to show successful SSL VPN logins, displaying the date/time, user, mode (tunnel or web) and the remote IP address the VPN was established from.
Enter the following in the 'Query' section:
2. Create chart:
Goto Reports > Chart Library and create a new chart (don't use the wizard to create the chart).
Enter a name, select 'Event' for the category, select the dataset you created in step 1 and change the 'Only Show First' to the amount of SSL VPN logins you want to show on the chart.
Next go through each column and change the header and the display values to the following:
Column 1:
Header: Date
Data Binding: date
Display: Text
Column 2:
Header: User
Data Binding: user
Display: Icon-User
Column 3:
Header: SSL Tunnel Type
Data Binding: tunneltype
Display: Text
Column 4:
Header: Remote IP
Data Binding: remote_ip
Display: Text
Click 'Ok' to save. Your end chart should look like this:

3. Create report:
Rightclick on the Report section and select 'Create New'

From here give your report a name, select the FortiGates you want to run the report for (or select 'All FortiGates to run it for all of them). Click Apply to save and you'll be taken to this screen:
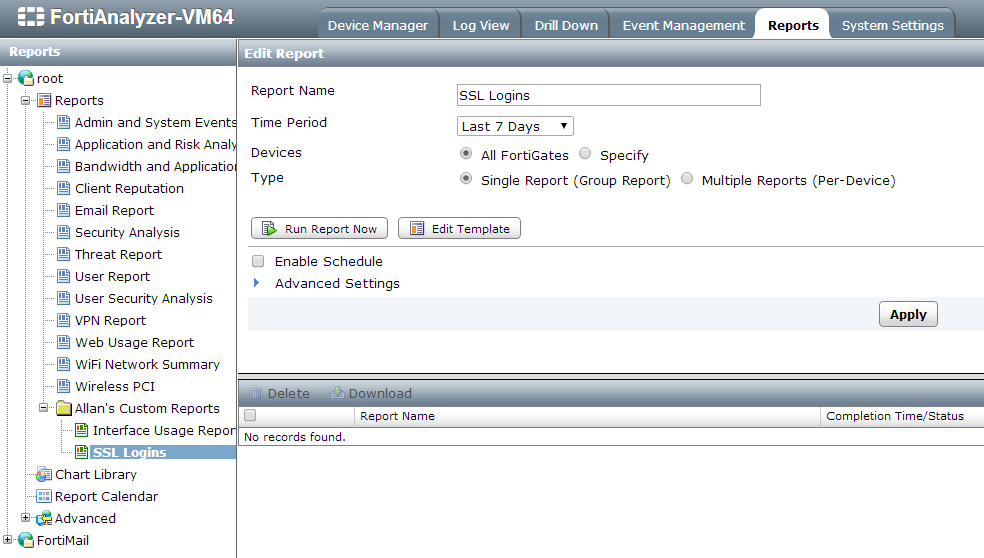
Now click on 'Edit Template' to configure the chart to be run in the report.
Once here drag a textbox to the 'Header Text' section and type in your report name. Next drag a chart (circled in red) to the main body and select the chart we created in step 2. Your final report should look like this:


This config is done on a FortiAnalyzer running 5.0.6.
The steps required are as follows:
1. Create dataset
2. Create chart
3. Create report
1. Create dataset:
To create a dataset goto the 'Reports' tab on your FortiAnalyzer then browse to Advanced > Dataset. From here click on 'Create New' and enter a name, select 'Event' for the 'Log Type'.
Enter the following in the 'Query' section:
select from_dtime(dtime) as date, `user`, tunneltype, action , remote_ip from $log where (tunneltype = 'ssl-tunnel' or tunneltype = 'ssl-web') and action = 'tunnel-up' order by date desc
Once this is done you can click on the 'Test' button to make sure it's working correctly then click 'Ok' to save. Your final dataset should look something like this:

Goto Reports > Chart Library and create a new chart (don't use the wizard to create the chart).
Enter a name, select 'Event' for the category, select the dataset you created in step 1 and change the 'Only Show First' to the amount of SSL VPN logins you want to show on the chart.
Next go through each column and change the header and the display values to the following:
Column 1:
Header: Date
Data Binding: date
Display: Text
Column 2:
Header: User
Data Binding: user
Display: Icon-User
Column 3:
Header: SSL Tunnel Type
Data Binding: tunneltype
Display: Text
Column 4:
Header: Remote IP
Data Binding: remote_ip
Display: Text
Click 'Ok' to save. Your end chart should look like this:
Rightclick on the Report section and select 'Create New'
From here give your report a name, select the FortiGates you want to run the report for (or select 'All FortiGates to run it for all of them). Click Apply to save and you'll be taken to this screen:
Once here drag a textbox to the 'Header Text' section and type in your report name. Next drag a chart (circled in red) to the main body and select the chart we created in step 2. Your final report should look like this:
Click 'Save' then 'Return' to go back to the report. Once here click on 'Run Now' to run the report. Once the report is finished click it to open and view!
15 comments:
Hi There,
thanks for your good script on the fortianalyzer. is there anyway to add in another option whereby the report can show what users browsing when connected to the VPN?
regards,
Henry
Hi
Thanks for your script on the Fortianalyzer.
I changed a little this script, for print "Date / User / Group / Tunnel Type / tunnelid / Source IP / Timer " and would like to share:
- Consulta procurando um usuário especifico:
select from_dtime(dtime) as date, `user`, `group`, tunneltype, action, tunnelid, remip, tunnelip, TO_CHAR((`duration` || ‘second') :: interval, 'HH24:MI:SS') as "Horas", CASE WHEN tunneltype= 'ssl-web' THEN 'Portal VPN' ELSE 'VPN Connected' END as "Description" from $log where `user` = 'cmaj' and (tunneltype = 'ssl-tunnel' or tunneltype = 'ssl-web') and action = 'tunnel-down' order by date desc
- Consulta procurando um ID de conexao especifico:
select from_dtime(dtime) as date, `user`, `group`, tunneltype, action, tunnelid, remip, tunnelip, TO_CHAR((`duration` || ‘second') :: interval, 'HH24:MI:SS') as "Horas", CASE WHEN tunneltype= 'ssl-web' THEN 'Portal VPN' ELSE 'VPN Connected' END as "Description" from $log where `tunnelid` = '2006624517' or `tunnelid` = '2006624518' or `tunnelid` = '2006624519' or `tunnelid` = '2006624520' or `tunnelid` = '2006624522' or `tunnelid` = '2006624523' or `tunnelid` = '2006624524' or `tunnelid` = '2006624524' or `tunnelid` = '2006624526' or `tunnelid` = '2006624527' or `tunnelid` = '2006624528' and (tunneltype = 'ssl-web' or tunneltype = 'ssl-tunnel') and action = 'tunnel-down' order by date desc
sorry for the late comment,
but i tried to it but i get failure on the query, when i click on test:
"ERROR: column "remote_ip" does not exist
LINE 1: ...time(dtime) as date, "user", tunneltype, action , remote_ip ..."
replace "remote_ip" with "remip"
Hi Ricardo,
thanks for the SQL Syntax. IT´s working fine.
Kai
HI i used to query but it does not filter the date when you set it.
when i selected on configuration only yersterday i get more than one day.
thanks a lot,
Dear Al's
Great thanks for your info. Would you help to add the time of the vpn session termination in your dataset? It is helpful for audit purpose. Pls help...
Great help thanks alot.
it's work good for me
It really worked for me, although i had to change the variable remote_ip name to remip, because my FortiAnalyzer version(v6.0.6). But i can not extract the number of current vpn users with this. The number doesnt match with the output "diagnose vpn ssl statistics" from the firewall.
Hi guys,
I need your help. I am using FAZ v6.0.4-build0292.
I am trying to fetch a report on SSL VPN users login/logout time.
Can someone help with the Dataset Query please?
This currently i am using - its built in profile - "vpn-User-Login-history"
the query is as below -
"
select $flex_timescale(timestamp) as hodex, sum(total_num) as total_num from (select timestamp, devid, vd, remip, tunnelid, sum(tunnelup) as total_num, max(traffic_in) as traffic_in, max(traffic_out) as traffic_out from ###(select $flex_timestamp as timestamp, devid, vd, remip, tunnelid, (case when action='tunnel-up' then 1 else 0 end) as tunnelup, max(coalesce(sentbyte, 0)) as traffic_out, max(coalesce(rcvdbyte, 0)) as traffic_in from $log where $filter and subtype='vpn' and (tunneltype like 'ipsec%' or tunneltype like 'ssl%') and action in ('tunnel-up', 'tunnel-stats', 'tunnel-down') and tunnelid is not null group by timestamp, action, devid, vd, remip, tunnelid /*SkipSTART*/order by timestamp desc/*SkipEND*/)### t group by timestamp, devid, vd, remip, tunnelid having max(tunnelup) > 0 and max(traffic_in)+max(traffic_out)>0) t group by hodex order by total_num desc
"
But this doesn't give me Data/time, UserID column etc.
thanks
is it possible to track user activity, for example which server accessed or shared folder, if possible what query i need to execute?
The message here is tunneltype column doesn't exist.
Post a Comment